

The Shock Absorber Is Shaking
Stock investors expect drama. Bond investors usually don’t. This week’s chart shows that deal is on shaky ground.
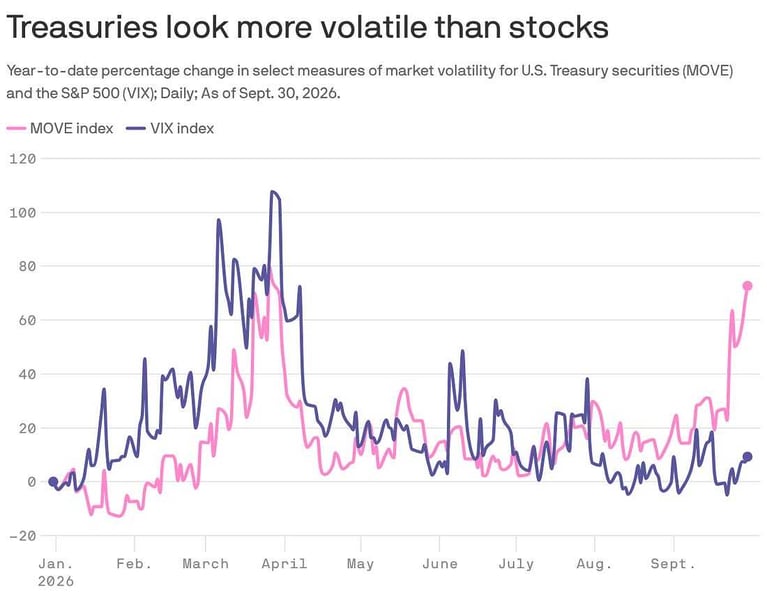
Through September 30, the MOVE index (the bond market’s version of the VIX, measuring expected swings in Treasury yields) was up about 73% for the year. The VIX was up about 9%. Rewind to late March, with the Middle East war in its second month: the VIX was up more than 100% and bonds were the calm ones. Six months later, they’ve traded places.
A caveat for the purists. MOVE is quoted in basis points of yield and the VIX in percent of price, so the raw levels don’t compare. Here’s my back-of-envelope translation. A MOVE near 105 implies yields swinging about 1.05 percentage points a year. On a 10-year Treasury (duration of roughly 7.7), that’s about 8% price volatility, half the VIX’s 16. On the 30-year (duration near 14.5), it’s about 15%. That’s equity-sized volatility in the asset you bought to avoid equity volatility.
So what’s rattling the long end of the yield curve? Four things, arriving together:
The Fed raised rates on September 16, its first hike in three years, and at month-end markets put the odds of another in October at about 70%.
The Bank of Japan is tightening. This is forcing a continued unwinding of the so-called “Yen Carry Trade”, and what Ed Yardeni calls the “Revenge of the Bond Vigilantes.”
Washington’s interest bill is about $1.1 trillion a year, up from $300 billion at the end of 2018.
The 30-year Treasury hit 5.50% on September 24, its highest since 2004. It finished this week near 5.6%.
Yardeni also notes that inflation expectations have barely moved. That points to term premium: investors want more yield to compensate for lending long to a government that keeps borrowing.
And the cushion? The iShares 20+ Year Treasury Bond ETF (TLT) was down 9.8% for the year as of September 28, at its lowest close since its 2002 launch. Long bonds are supposed to protect you when the shock is weak growth. When the shock is inflation or the government’s balance sheet, stocks and bonds fall together. Ask anyone who owned a 60/40 portfolio in 2022.
Stocks have shrugged so far, mostly because analysts expect third-quarter S&P 500 earnings to grow 29%. Morgan Stanley’s Andrew Pauker says “Equities can tolerate 5% yields if growth is strong,” but the scenario to avoid is “an accelerated move higher in the long end.”
We take a risk first approach to investing. Dennis DeBusschere of 22V Research says recession risk “could increase materially if 10yr yields move quickly above the ~5.5% level.” The 10-year closed Friday near 5.25%. Add a fast quarter-point and the shrugging could very well stop, with stocks and bonds falling together.
The better path is a Fed pause, a calmer Japan, and a MOVE that drifts back down, the way it did after the spring spike.
I suggest that at 5.25%, a 10-year Treasury can absorb roughly a two-thirds-point rise in yields over a year before its total return goes negative. That’s a real cushion, and it comes from income. For protection against a stock selloff, I want something built to pay off when stocks fall. Bonds used to do both jobs. Right now they’re doing one.
James Carville said in 1993 that he wanted to come back as the bond market, because “you can intimidate everybody.” Thirty-three years later, the bond market is still at it.
Sources: Axios, “Bond market zig zags threaten S&P 500’s smooth ride” (Matt Phillips, Oct. 2, 2026); Benzinga, “MOVE Index Tops 100: Bond Volatility Gauge Jumps 35%”; Saxo, “Bond vol overtakes equity vol,” Sept. 25, 2026; Saxo, “Bond vol rose, bonds barely moved,” Sept. 30, 2026; investingLive, “FOMC rate decision: Fed hikes for the first time in three years”; TheStreet, Stock Market Today, Oct. 9, 2026; Bloomberg News, Sept. 29, Yardeni Interview.